Abu Dhabi Environment Agency
Bill & Melinda Gates Foundation
C40 Cities Climate Leadership Group
California Department of Water Resources
Center for International Forestry Research (CIFOR)
Climate and Development Knowledge Network (CDKN)
ClimateWorks Foundation
Combat Climate Change (3C AB)
Danish Institute for International Studies (DIIS)
DeLaval International AB
Deutsche Gesellschaft für Internationale Zusammenarbeit (GIZ) GmbH
Earthjustice
EcoEquity
Ecosystem Services for Poverty Alleviation (ESPA)
Ecotrust
Environmental Integrity Project
Environmental Investment Centre (KIK)
Estonian Association for Environmental Management (EKJA)
Estonian Council of Environmental NGOs (EKO)
Estonian Ministry of the Environment
European Commission
European Environment Agency (EEA)
FONDEF
Global Utmaning
GreenStream Network Plc
Institute of Development Studies (IDS)
Inter-American Development Bank (IDB)
International Atomic Energy Agency (IAEA)
International Livestock Research Institute (ILRI)
International Water Management Institute (IWMI)
Japan International Cooperation Agency (JICA)
Jordbruksverket (Swedish Board of Agriculture)
Joseph Rowntree Foundation
KTH Royal Institute of Technology
Leeds City Council
Lincoln Institute
Miljödepartementet (Swedish Ministry of Environment)
National Oceanic and Atmospheric Agency
National UK Lottery
Natural Environment Research Council (NERC)
Natural Resources Defense Council (NRDC)
Naturvårdsverket (Swedish EPA)
Nordea Fonder AB
NordForsk
Nordic Council of Ministers
Okeanos Foundation
Palestinian Water Authority
PricewaterhouseCoopers Services Ltd, CDKN
Regeringskansliet (Government Offices of Sweden)
Renewable Energy & Energy Efficiency Partnership (REEEP)
Riksbankens Jubileumsfond
Rockefeller Brothers Fund
Secretariat of the Andes Community
Serious Nature
Sinclair Knight Merz Pty Ltd
SINTEF Energi AS
Steiger Engineering OÜ
Stockholm International Water Institute (SIWI)
Swedish Chemicals Agency (KEMI)
Swedish Civil Contingencies Agency (MSB)
Swedish Defence Research Agency (FOI)
Swedish International Development Cooperation Agency (Sida)
Swedish Meteorological and Hydrological Institute (SMHI)
Swedish Research Council for Envir., Agr.Sc. and Spatial Planning (FORMAS)
Svenska PostkodStiftelsen
Sveriges Kommuner och Landsting (SKL)
Tallinn Technical University
Tallinn University
Tallinna Autobussikoondise AS
Tartu University
The Commonwealth Scientific and Industrial Research Organization (CSIRO)
The Swedish Foundation for Strategic Environmental Research (Mistra)
U.S. Bureau of Reclamation
U.S. Environmental Protection Agency
U.S. State Department
UK Department for International Development (DFID)
UK Dept for Environment, Food and Rural Affairs (DEFRA)
Union of Concerned Scientists
United Nations (UNDP, UNEP, UNESCO, UNFCCC, UNOPS, FAO)
United States Agency for International Development (USAID)
Water Research Foundation
Vattenfall AB
World Bank
World Wildlife Fund (WWF)
Yorkshire Forward (Regional Development Agency)


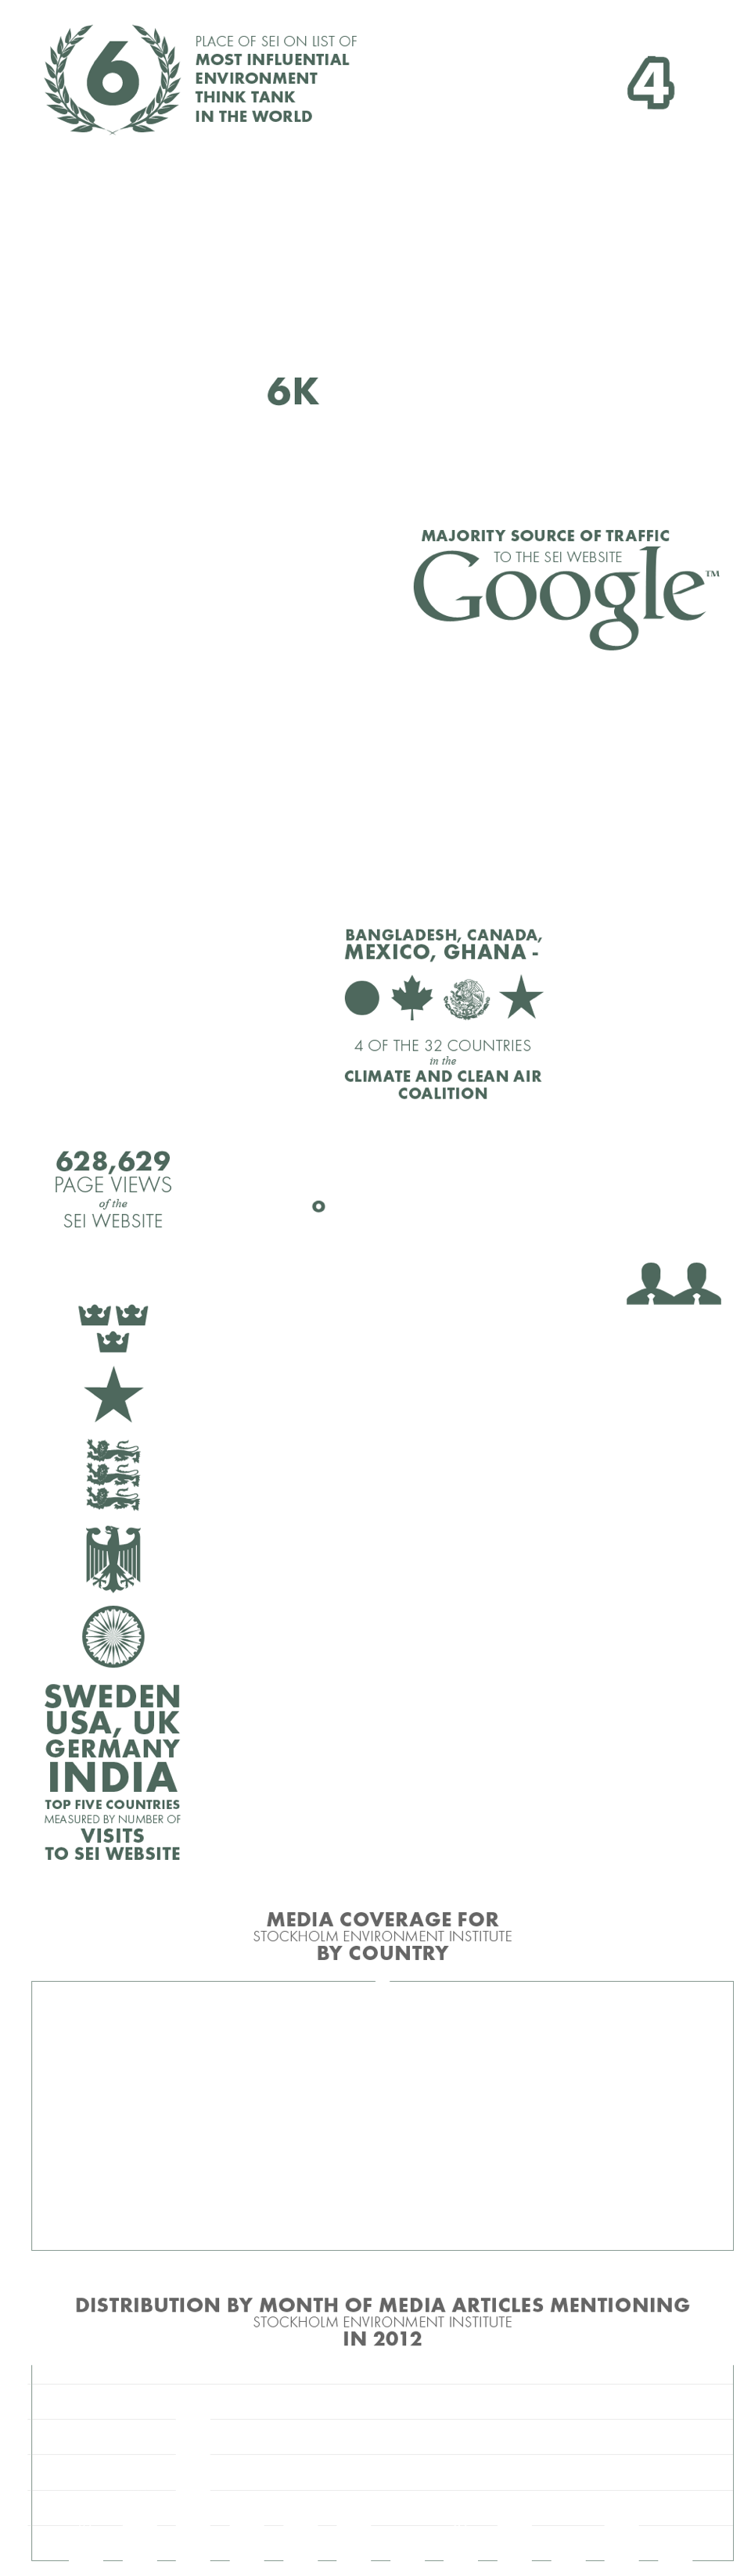
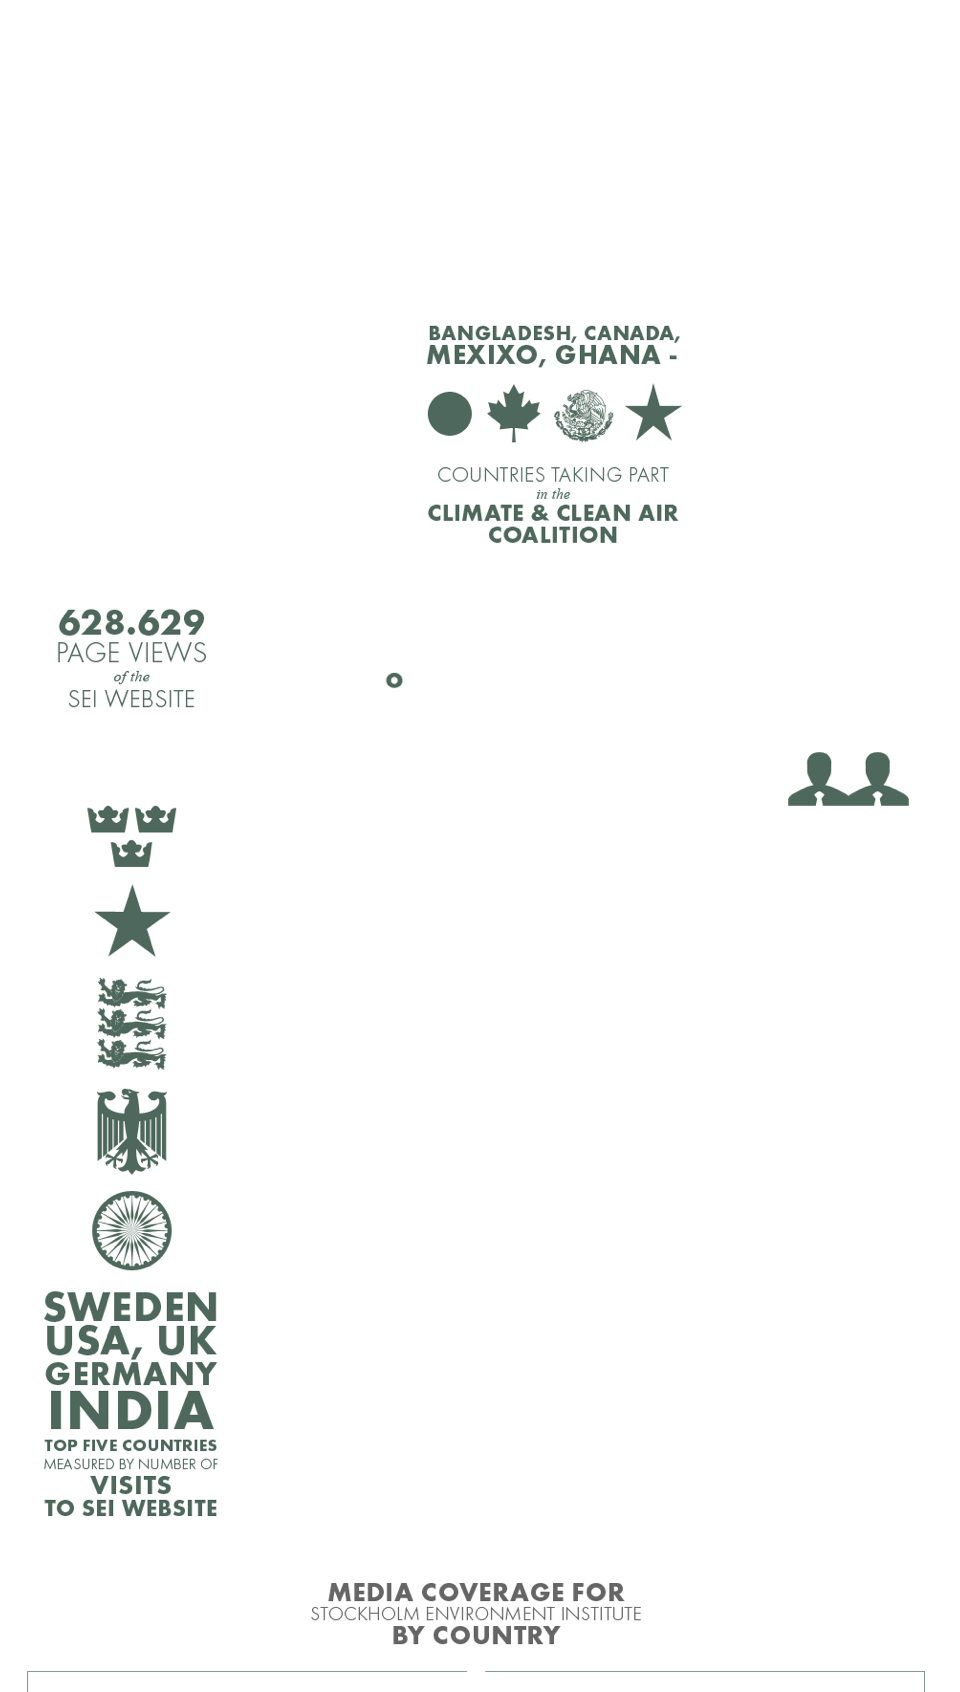 This infographic reviews communication highlights from 2012. Find out what could cost two trillion US dollars, and see key numbers on our web stats, media coverage, and major events.
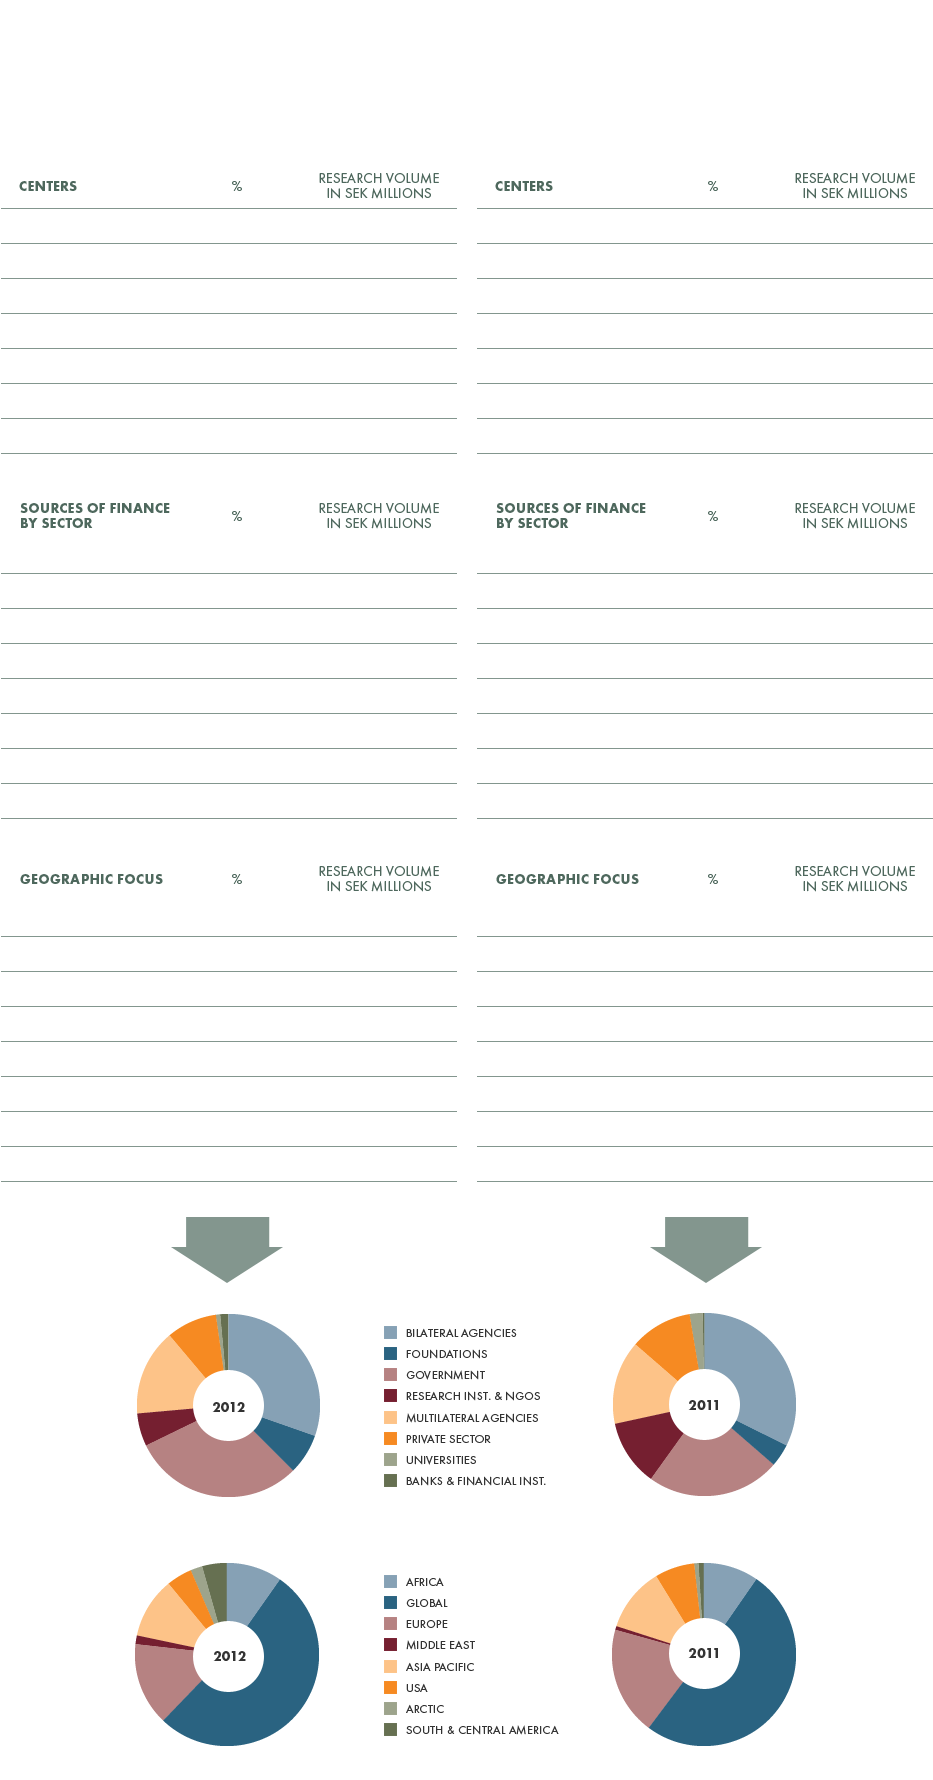
 Last year, SEI both consolidated and developed its financial position. In particular, our core support from the Swedish Government increased by around 40 per cent on the previous year.


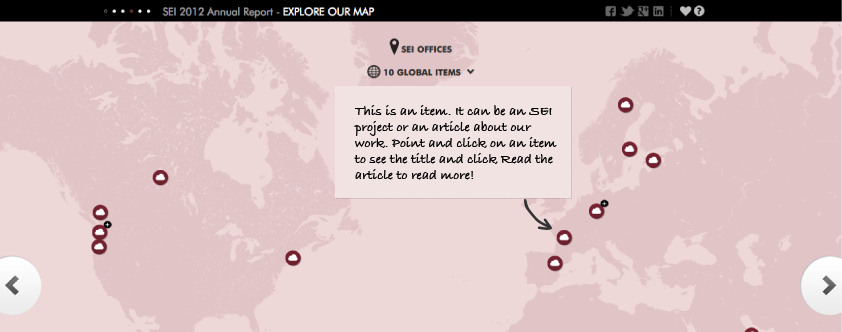
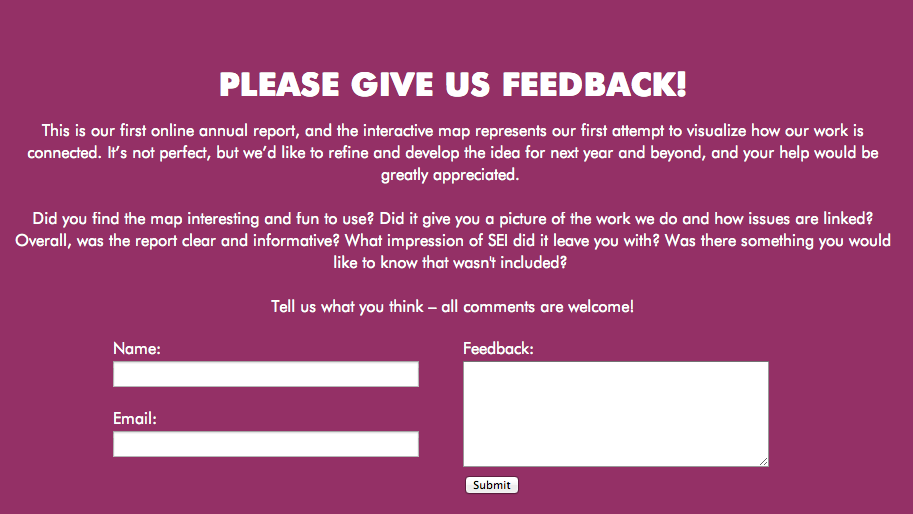 Please feel free to send us feedback. You'll find a form to use for sending us your thoughts on the last section on the main path. Just fill in the form and click Send to share your thoughts with us.